
4. Highly accurate buy/sell signals
The CodeAce Algo Trading Indicator provides timely and accurate buy and sell signals, allowing you to make well-informed decisions. Follow these steps to interpret the signals:
5. Strong signal analysis
Dive deeper into market conditions with strong signals that incorporate advanced technical parameters. Gain insights into market trends with the Strong Signal Analysis feature:
Enable Smart Trail: off
Note: Please make a note that, strong means higher probability,
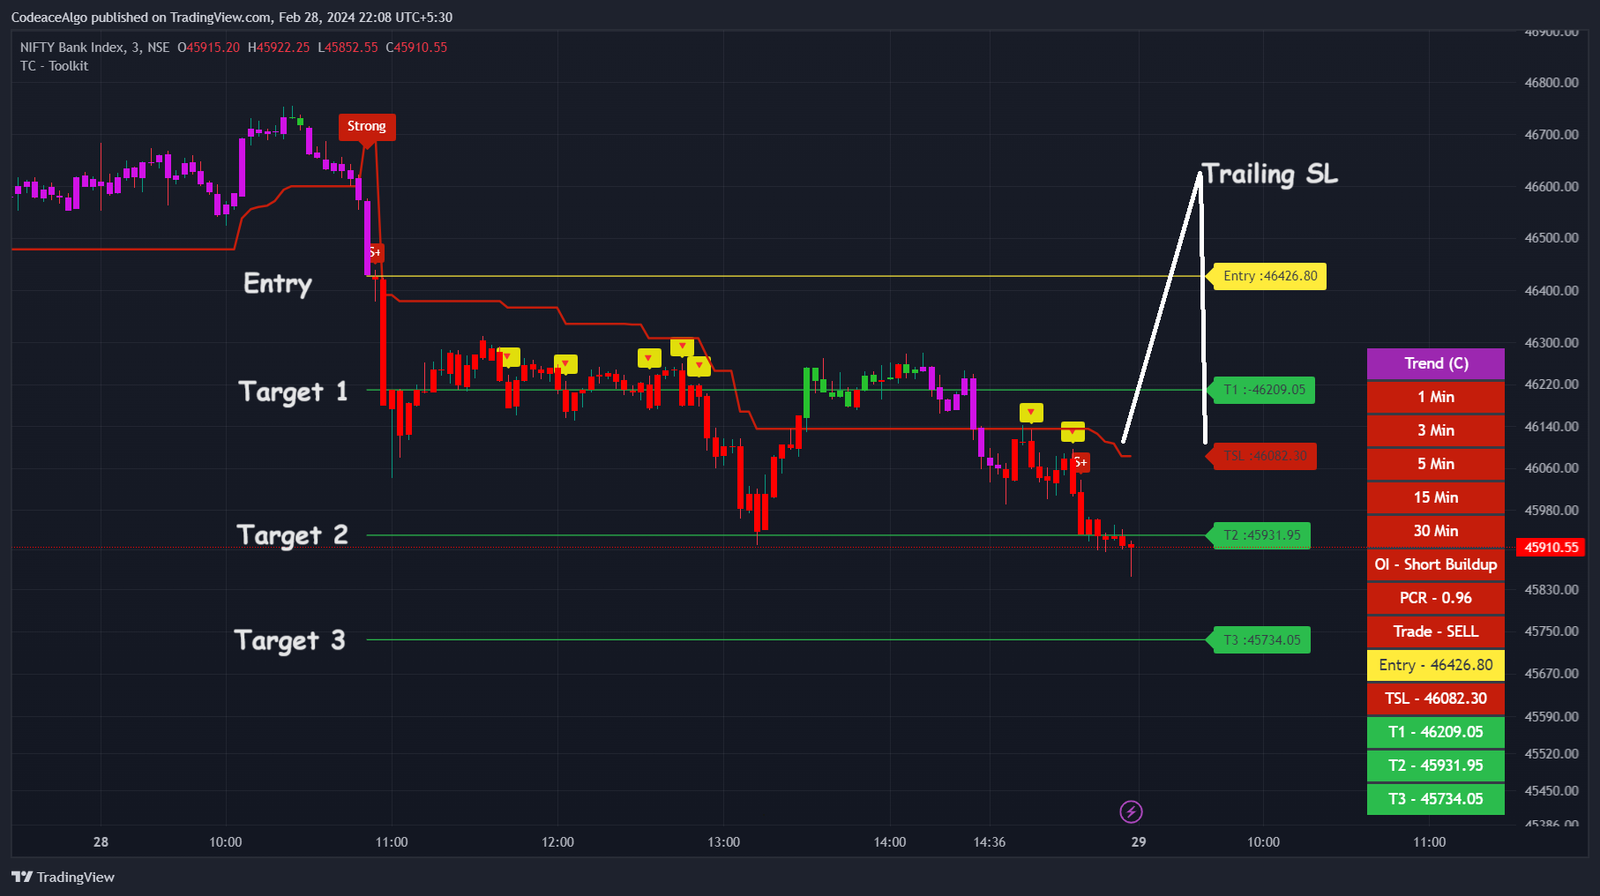
6. Proper entry, stoploss, and target points
The indicator displays clear entry points, stop loss, and three target levels for each trade. Follow these guidelines for effective trade execution.
Enable Smart Trail setting: off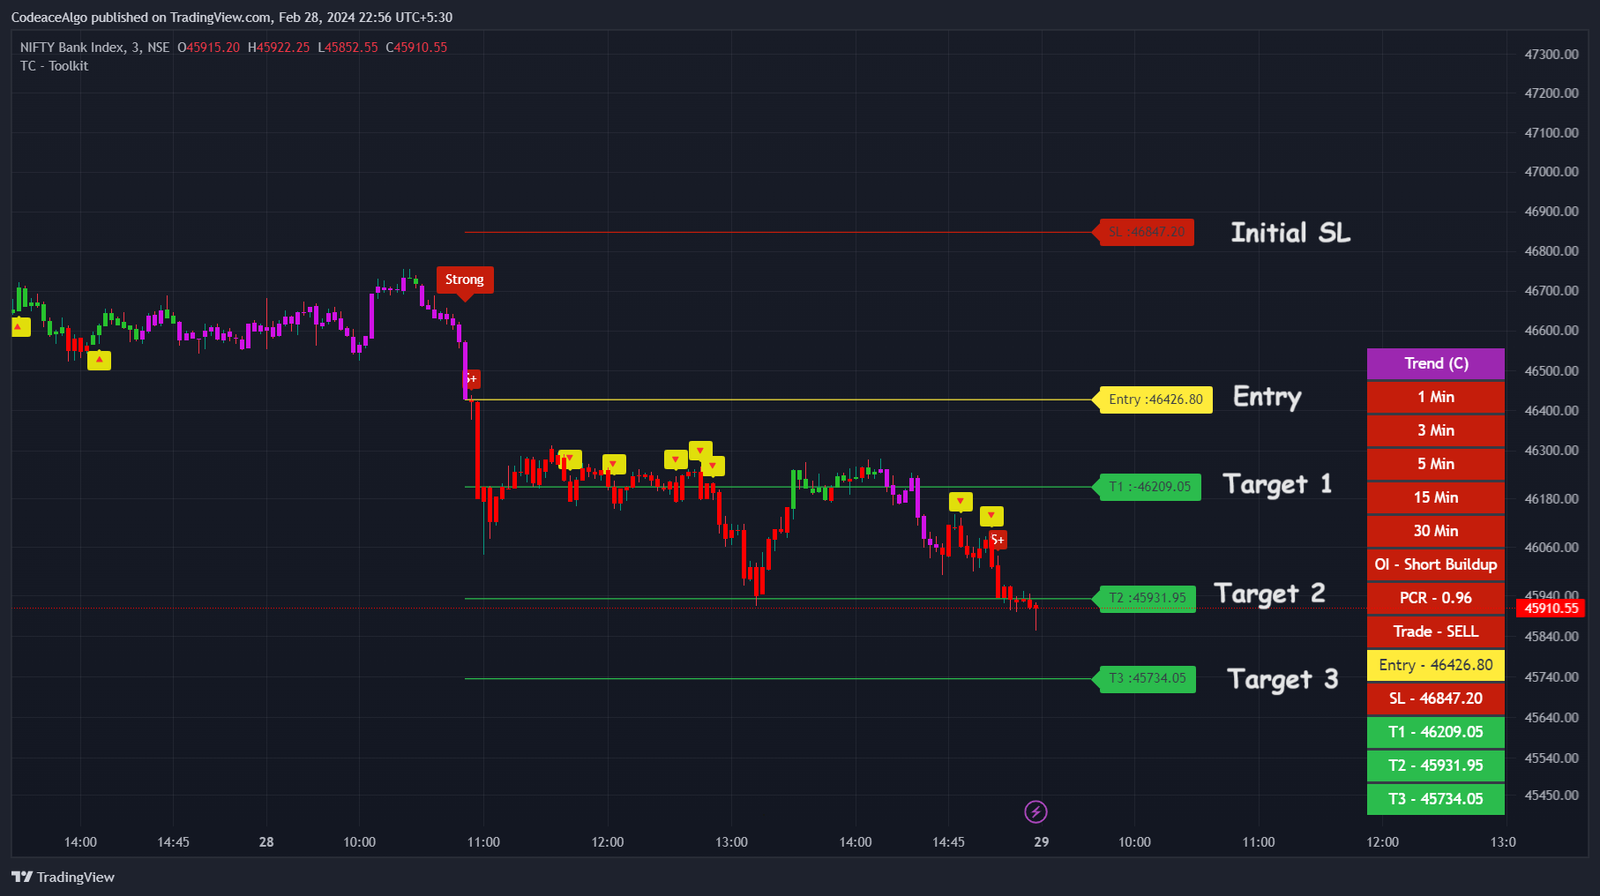
Enable Smart Trail Setting : on
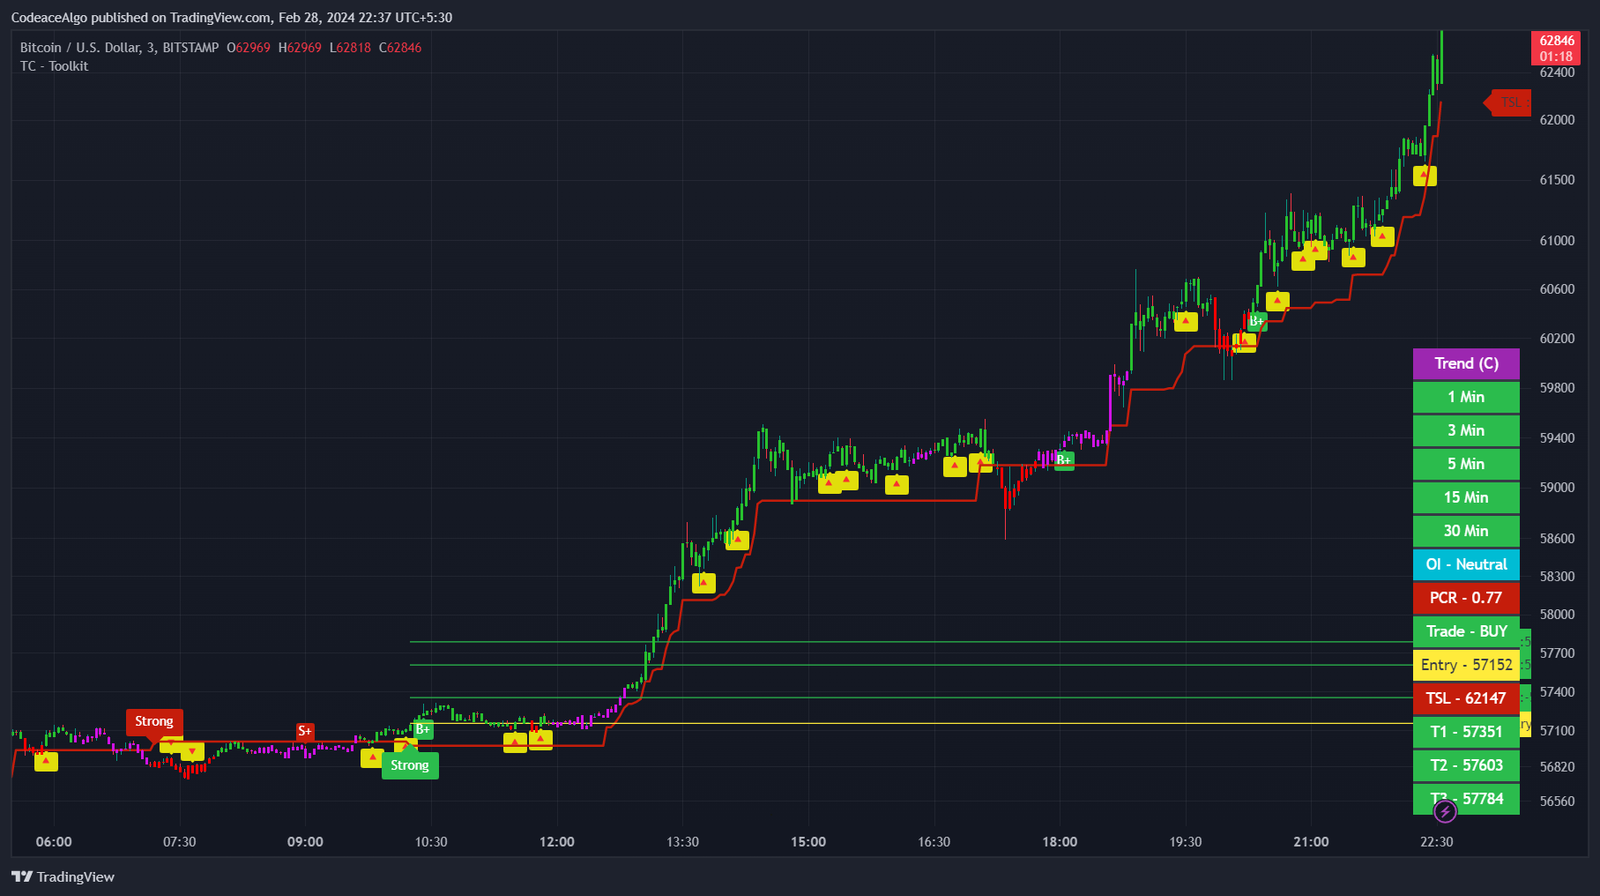
7. Smart trail to maximum your reward
Activate the Smart Trail feature to capture significant reward while the trend is in your favor. Maximize your gains by following these steps.
Enable Smart Slow/Fast Trail setting: off
Enable Smart Slow Trail Setting : on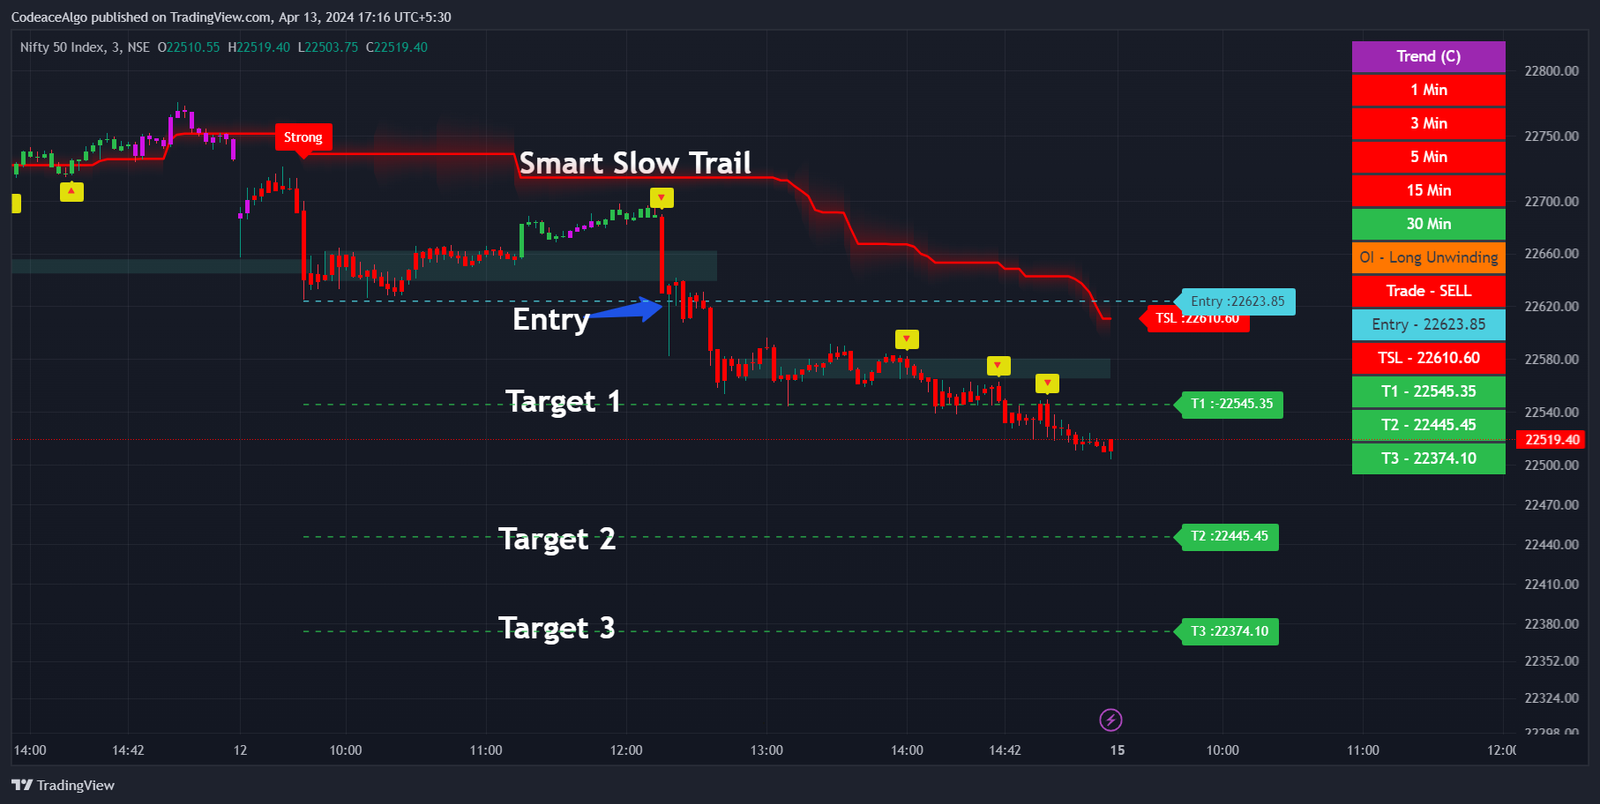
Enable Smart Fast Trail Setting : on

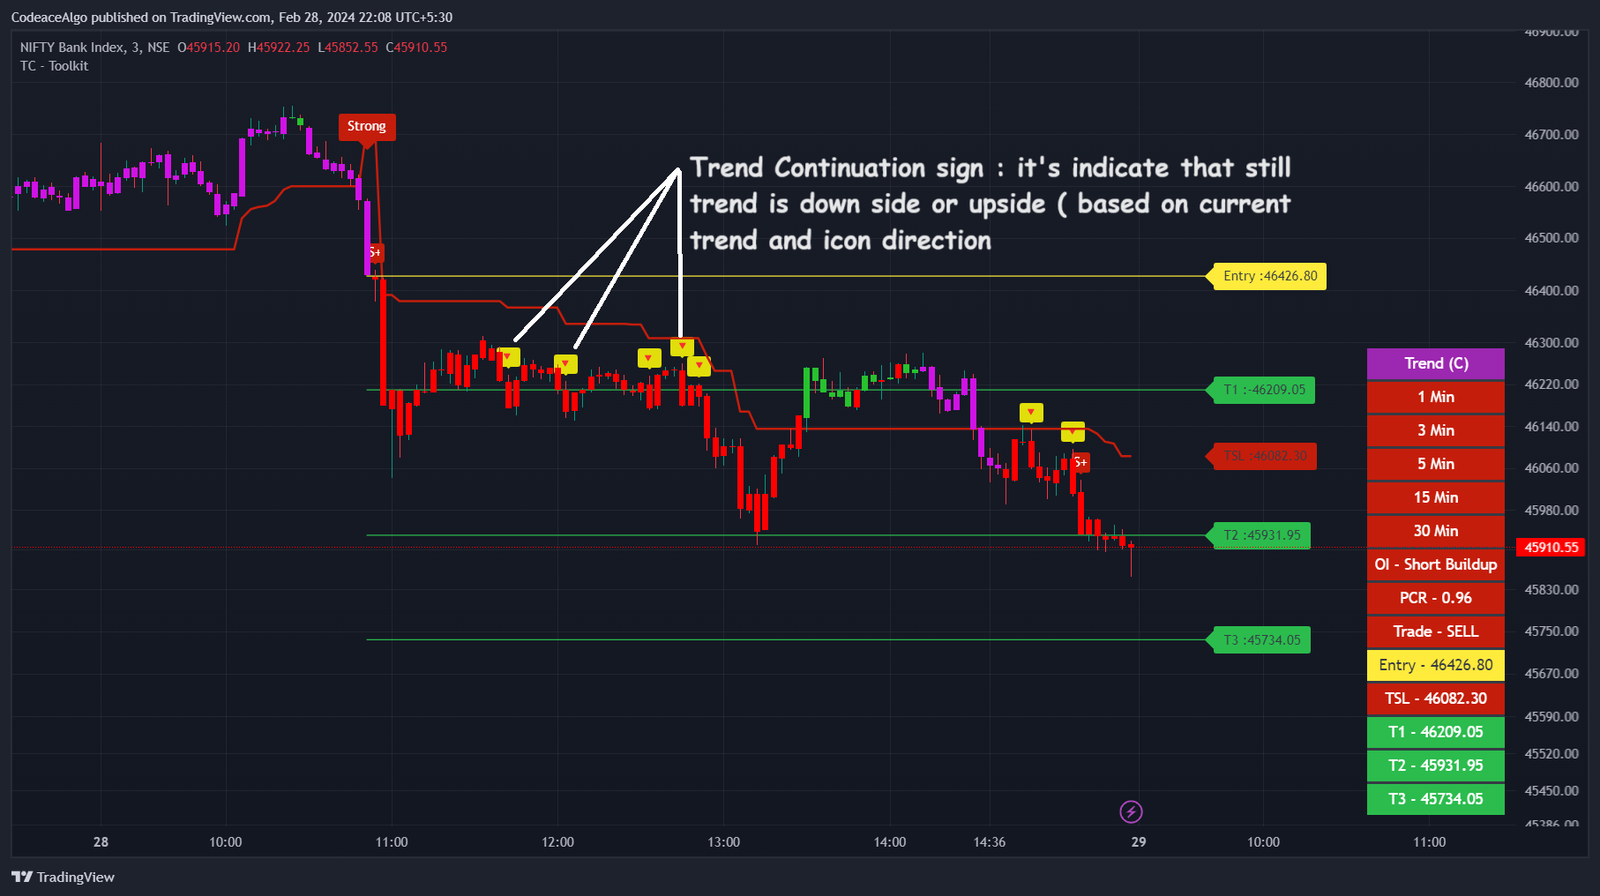
8. Trend continuation sign
Stay in your current trade confidently with the Yellow Trade Continuation Sign. This feature guides you to exercise patience and maximize your gains

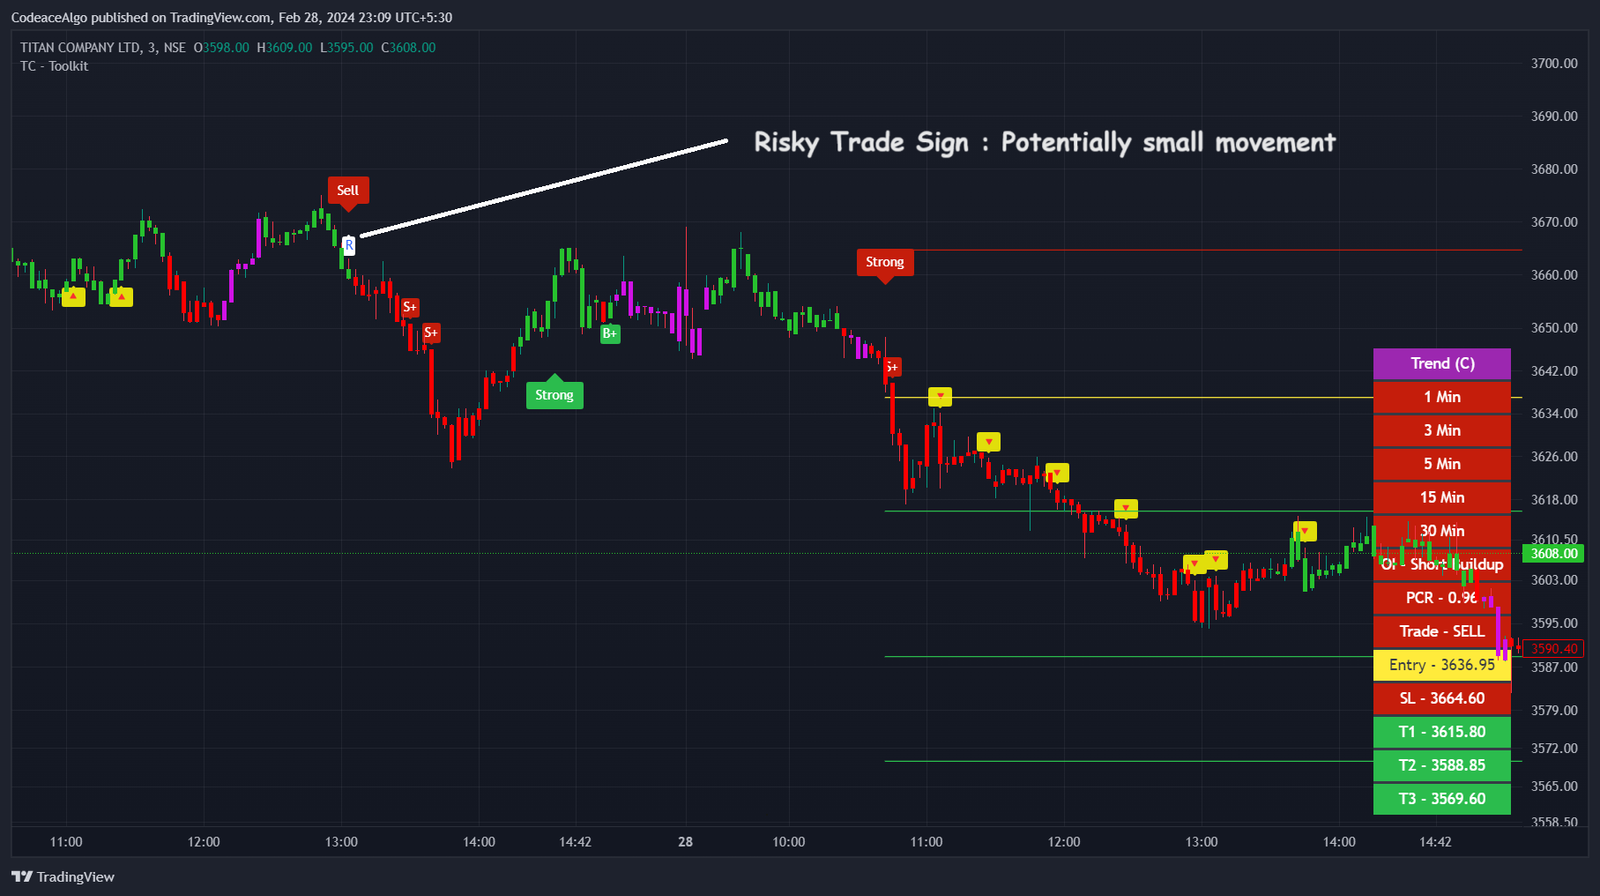
9. Risky trade Sign
Identify potentially risky trades with the Risky Trade Signal. Take calculated risks with limited quantities, especially in smaller trends
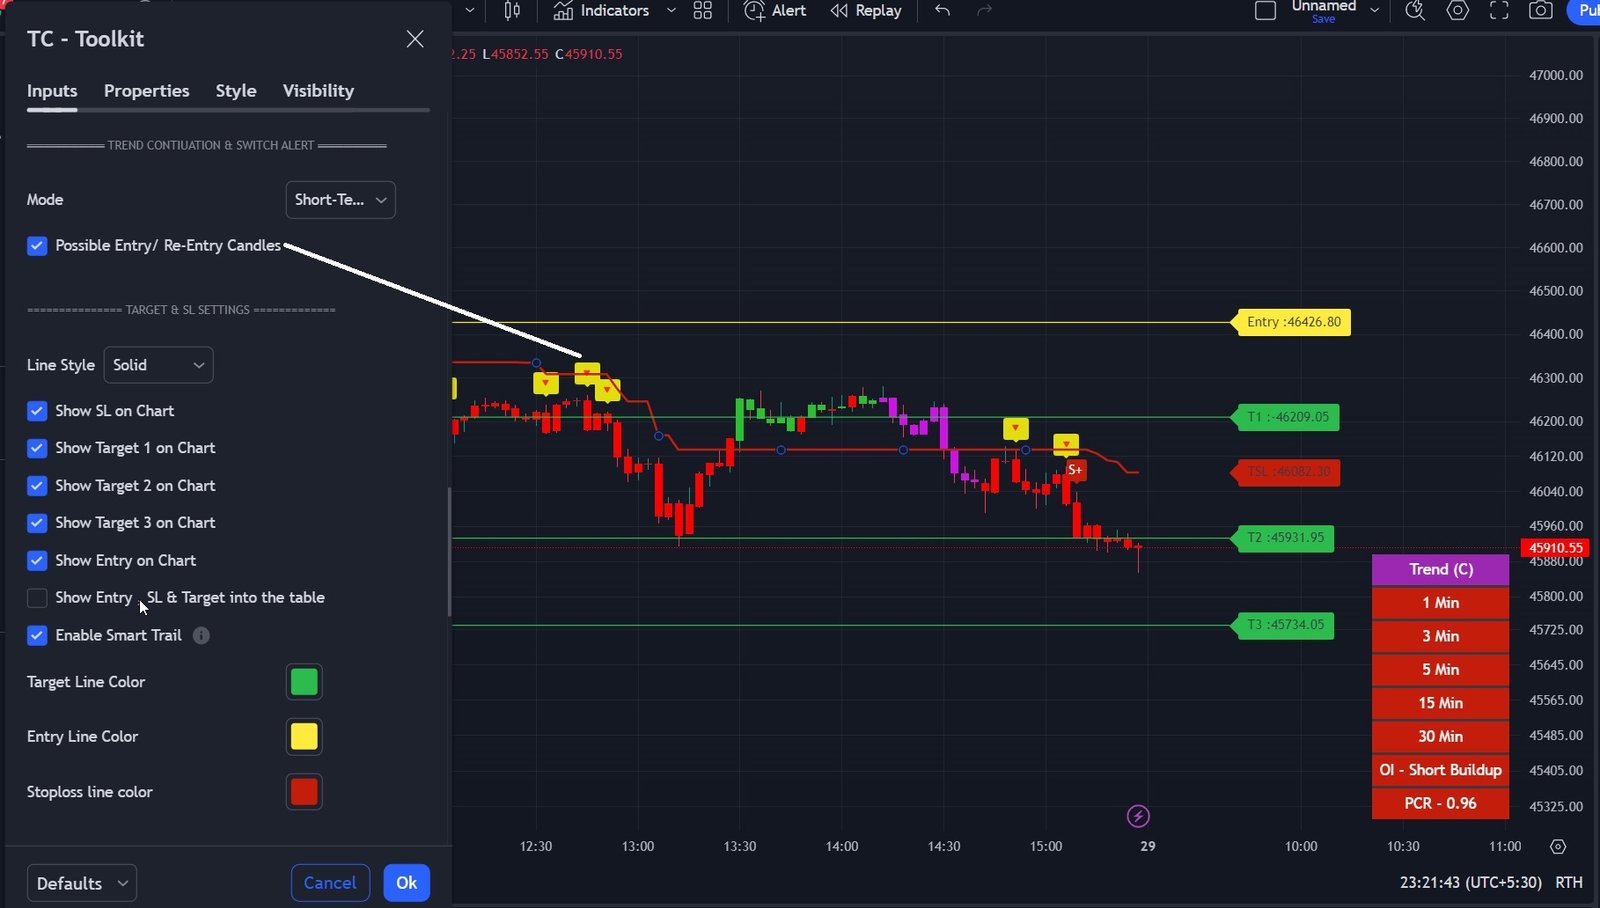
10. Multi Timeframe trend analysis helper table
Gain valuable insights into the current trend across multiple time frames. The Trend Helper Table includes daily open interest and put-to-call ratio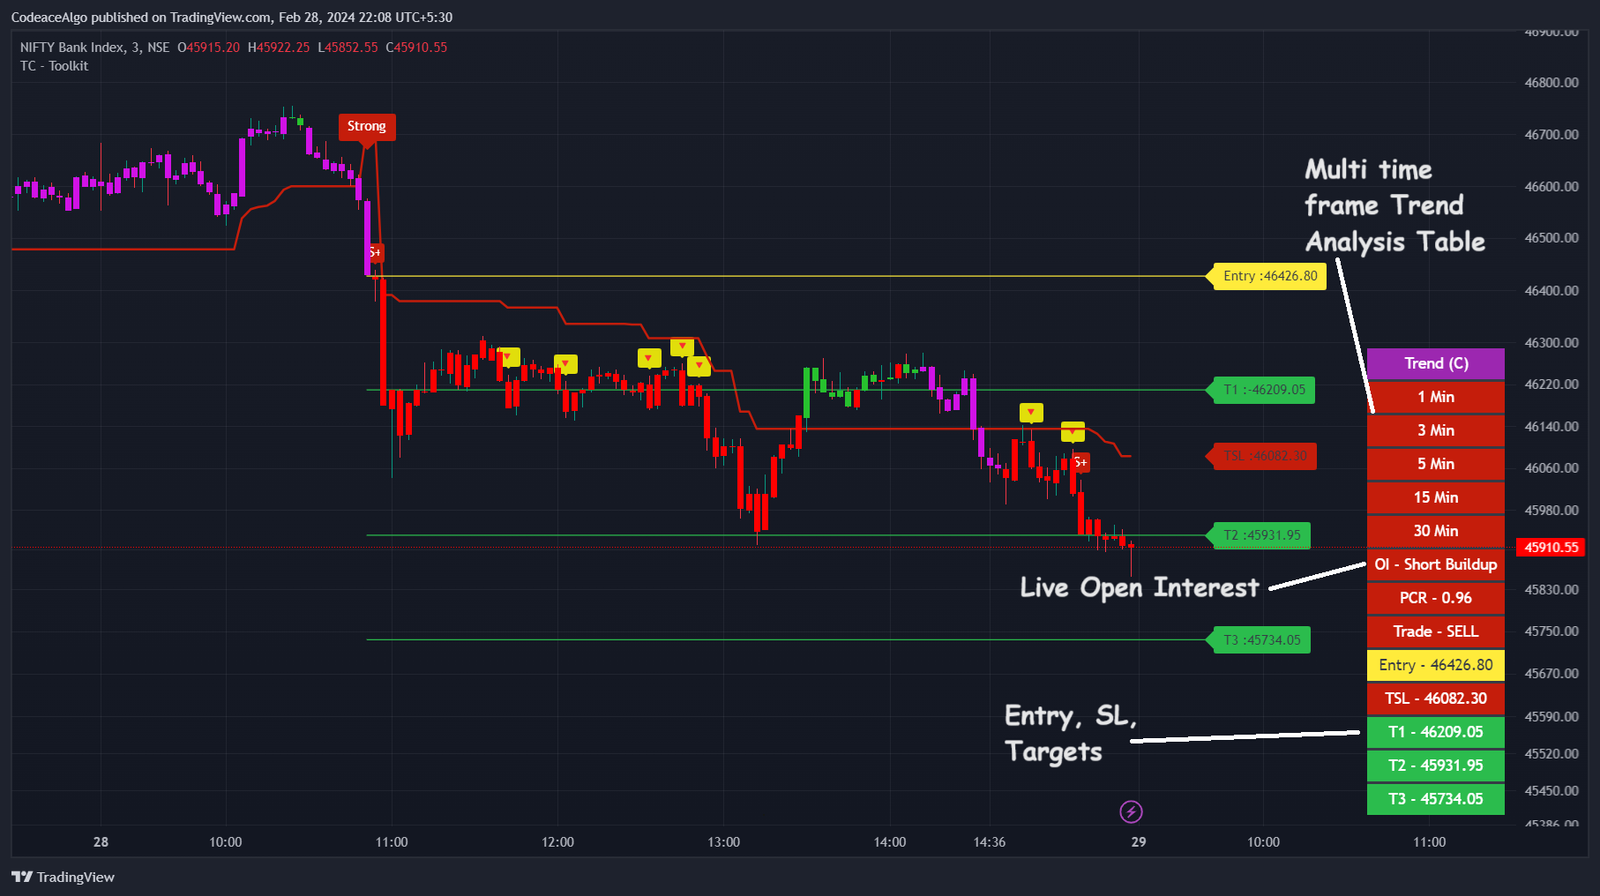
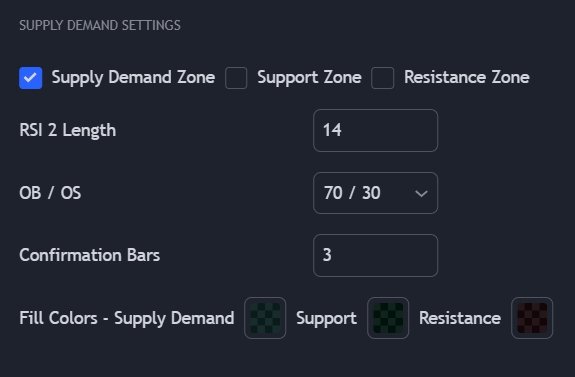
12. Support & Resistance
You Can Plot or add Support & Resistance on the chart
- Support and resistance levels can act as psychological barriers for traders. Market participants tend to remember previous price levels and react accordingly when the price approaches these levels again.
- Once a support level is breached, it may become a resistance level, and vice versa. This phenomenon is known as “role reversal.”
- Support and resistance levels are not fixed and can change over time as market conditions evolve.
- Stronger support and resistance levels are often identified by higher trading volumes and longer periods of consolidation around those levels.
- Traders often use support and resistance levels to make trading decisions, such as entering trades near support levels and exiting trades near resistance levels.
You can see below screenshot how support help to understand the trend is reversed and can have more potential with new trend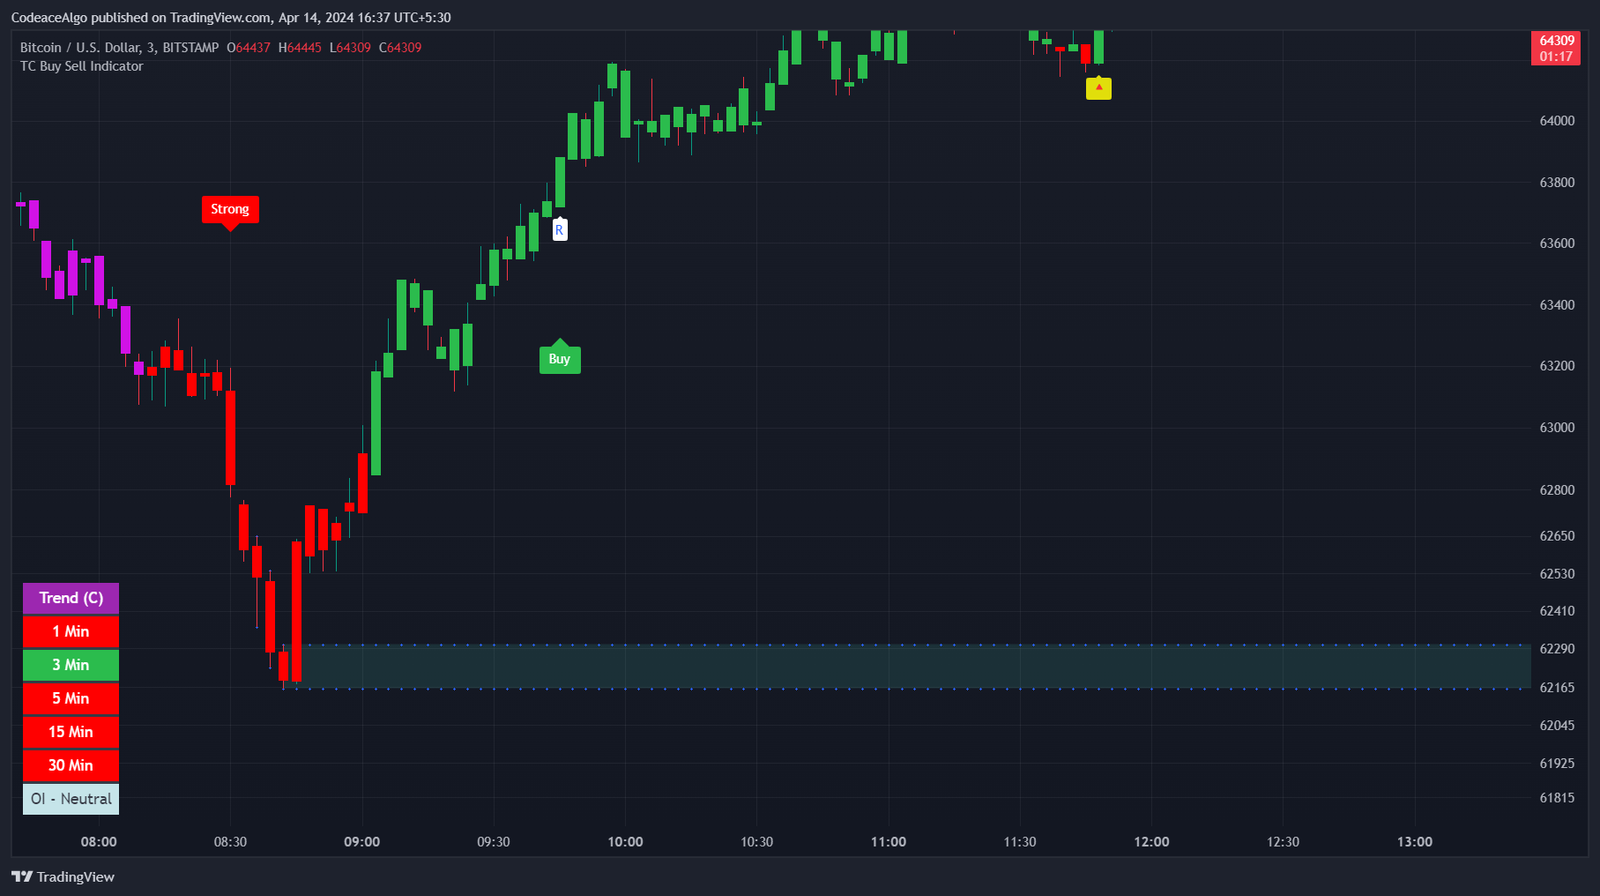
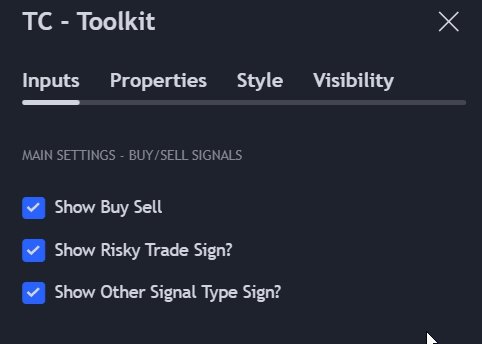
12. Configurability at your fingertips
Customize every aspect of the indicator to suit your trading style. All settings are configurable, ensuring a personalized and tailored experience
Show Buy Sell
- Enable Setting : to display the buy or sell signal on the chart
Show Risky Trade Sign
- Enable Setting : to display the Risky ( R) Sign, This sign indicate that trend may not extend more, so trade with small qty with low risk.
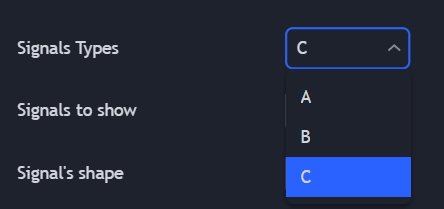
Show Other Signal Type Sign
- Enable Setting :
At CodeAce Algo, we’ve implemented a dynamic signal display feature to provide users with comprehensive insights into trading signals. With our platform, you can choose from three distinct signal types (A, B, and C) to generate buy or sell signals based on your preferences and market conditions.
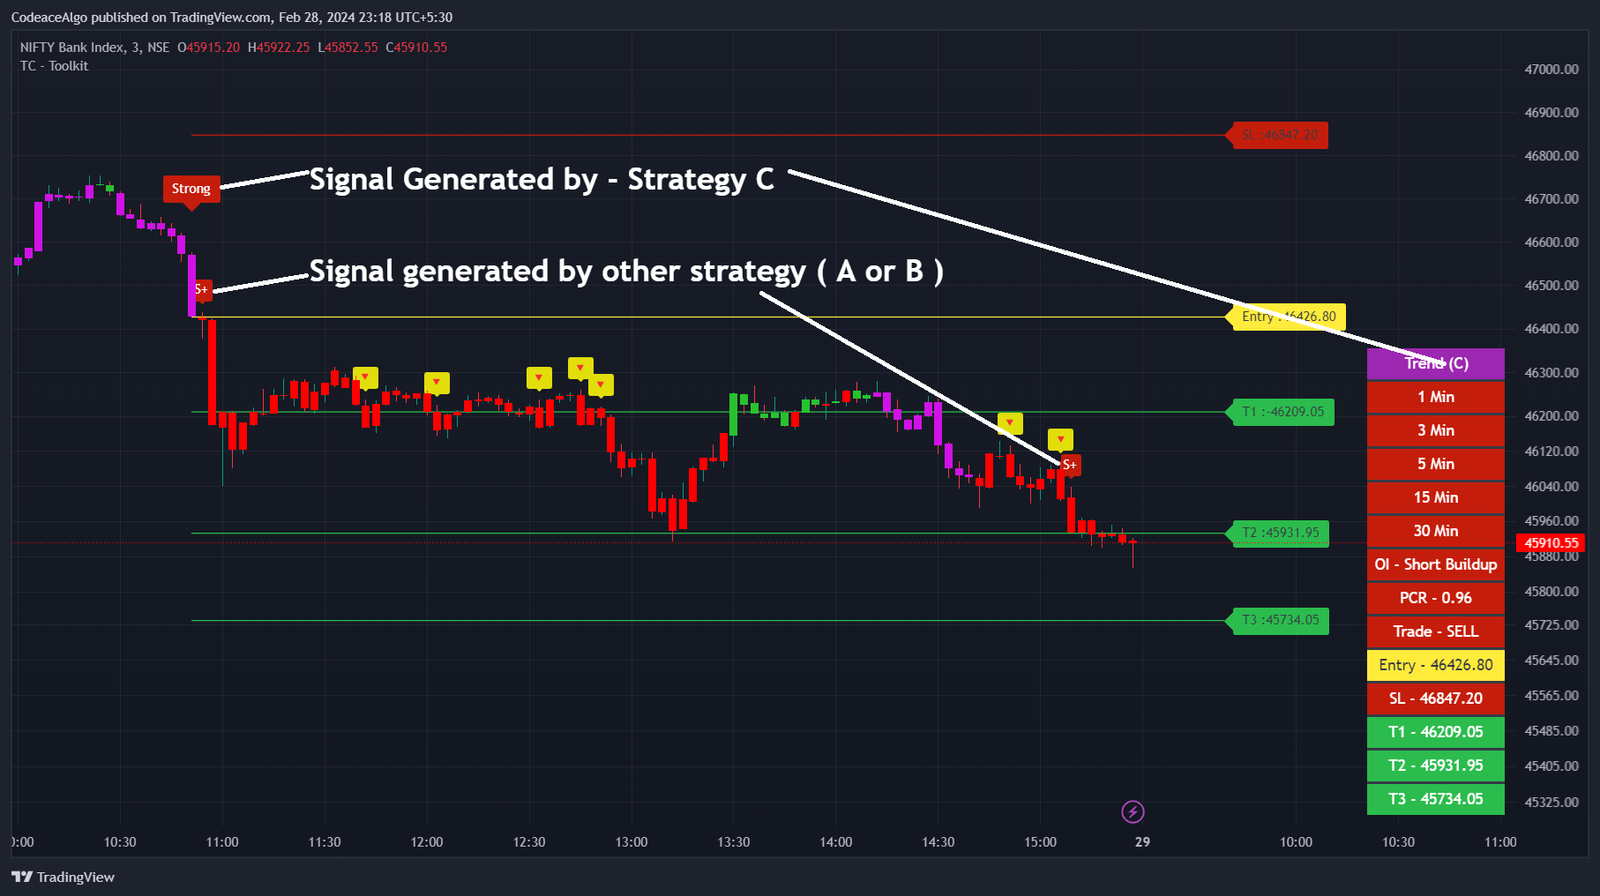
When you select a specific signal type, such as Type C, our system intelligently tracks and displays the generated signals on your trading chart. In the event of a sell signal, for example, the corresponding candle will be marked accordingly.
But here’s where our system goes the extra mile: if a sell signal is generated under Type C and is later replicated under Type A or B, our platform will automatically append a modifier to the signal display. In this case, a “(S+)” sign will be added to the respective candle, indicating that the same sell signal has been confirmed across multiple signal types.
This enhanced signal display not only provides clarity but also highlights the strength and consistency of trading signals across different strategies. With CodeAce Algo, you can make informed trading decisions backed by robust and reliable signal analysis.
Signal’s Addon Settings
At CodeAce Algo, we understand that one size does not fit all when it comes to trading strategies. That’s why our platform offers the flexibility to tailor your signal strategies to suit specific stocks or assets.
We offer a range of signal types, each designed to cater to different market conditions and asset classes. Whether you’re trading stocks, commodities, or forex, you can customize your strategy to optimize performance for your chosen assets.
For example, Strategy A may be well-suited for volatile assets like BankNifty, while Strategy B could be more effective for stable commodities like Silver. With our customizable settings, you have the flexibility to adjust parameters such as entry points, stop-loss levels, and target prices to align with the unique characteristics of each asset.
By empowering users to customize their signal strategies, we ensure that you can adapt to changing market conditions and maximize your trading opportunities effectively. Experience the power of tailored strategies with CodeAce Algo and take your trading to the next level.
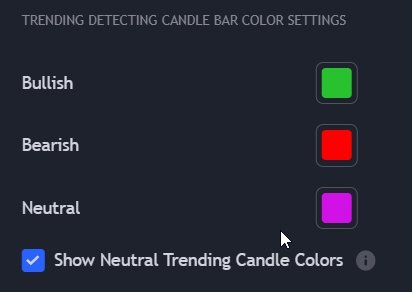
Show Trending Candle Colors
- Bullish : Color of the bar when trend is up
- Bearish : Color of the bar when trend is down
- Neutral : Color of the bar when market is sideways or flat

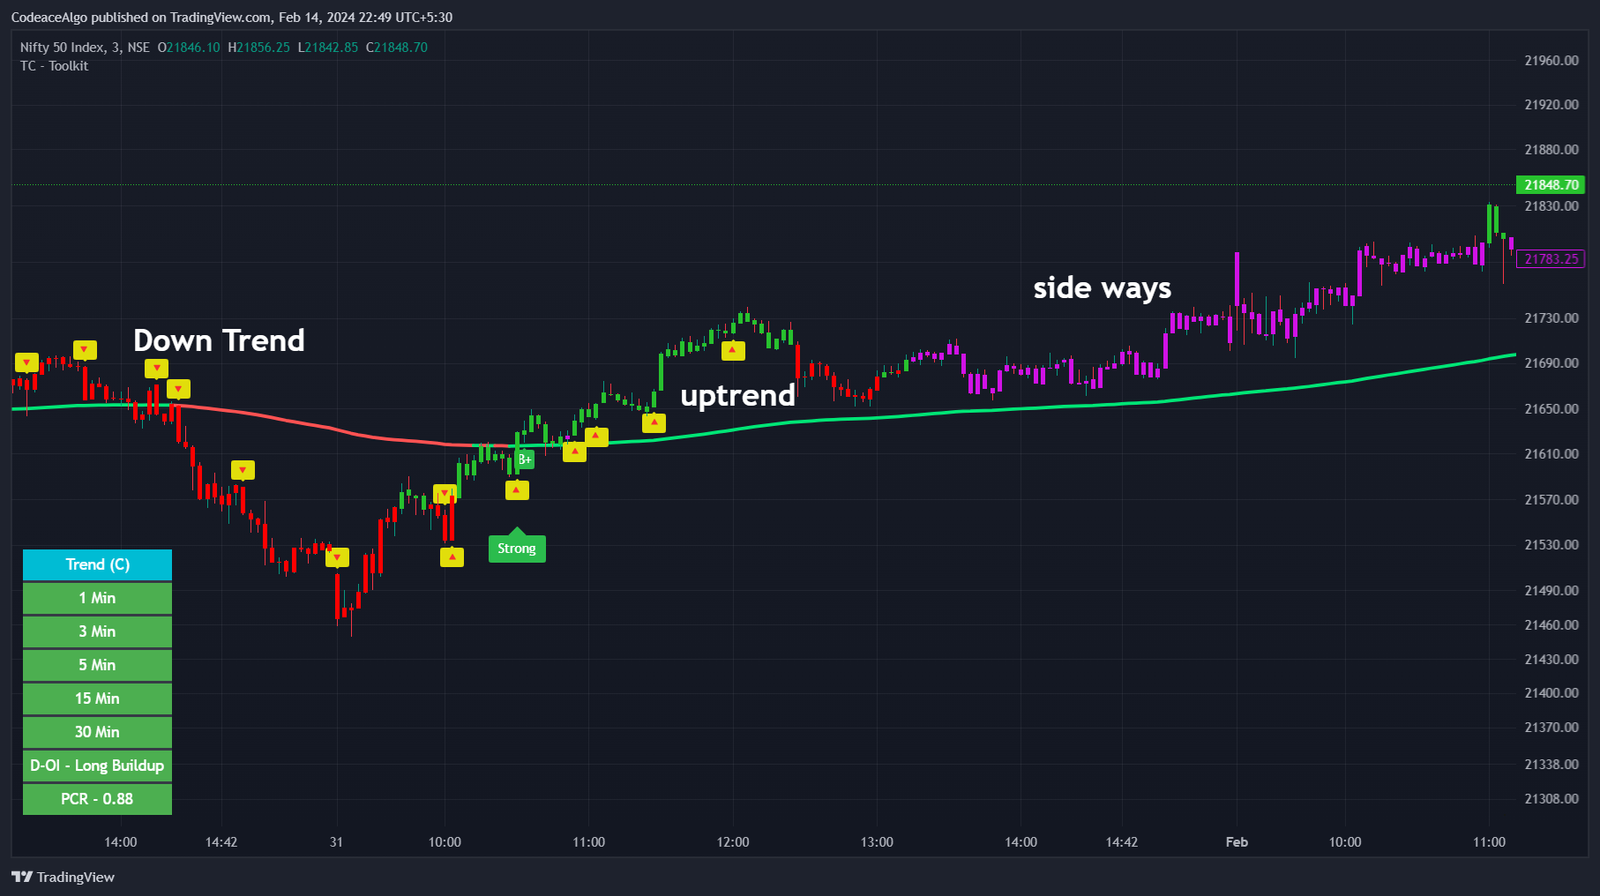
Show EMA Ribbon
Ema ribbon is the combination of the 20,50,100,200 ema, which help’s to understand the current trend.

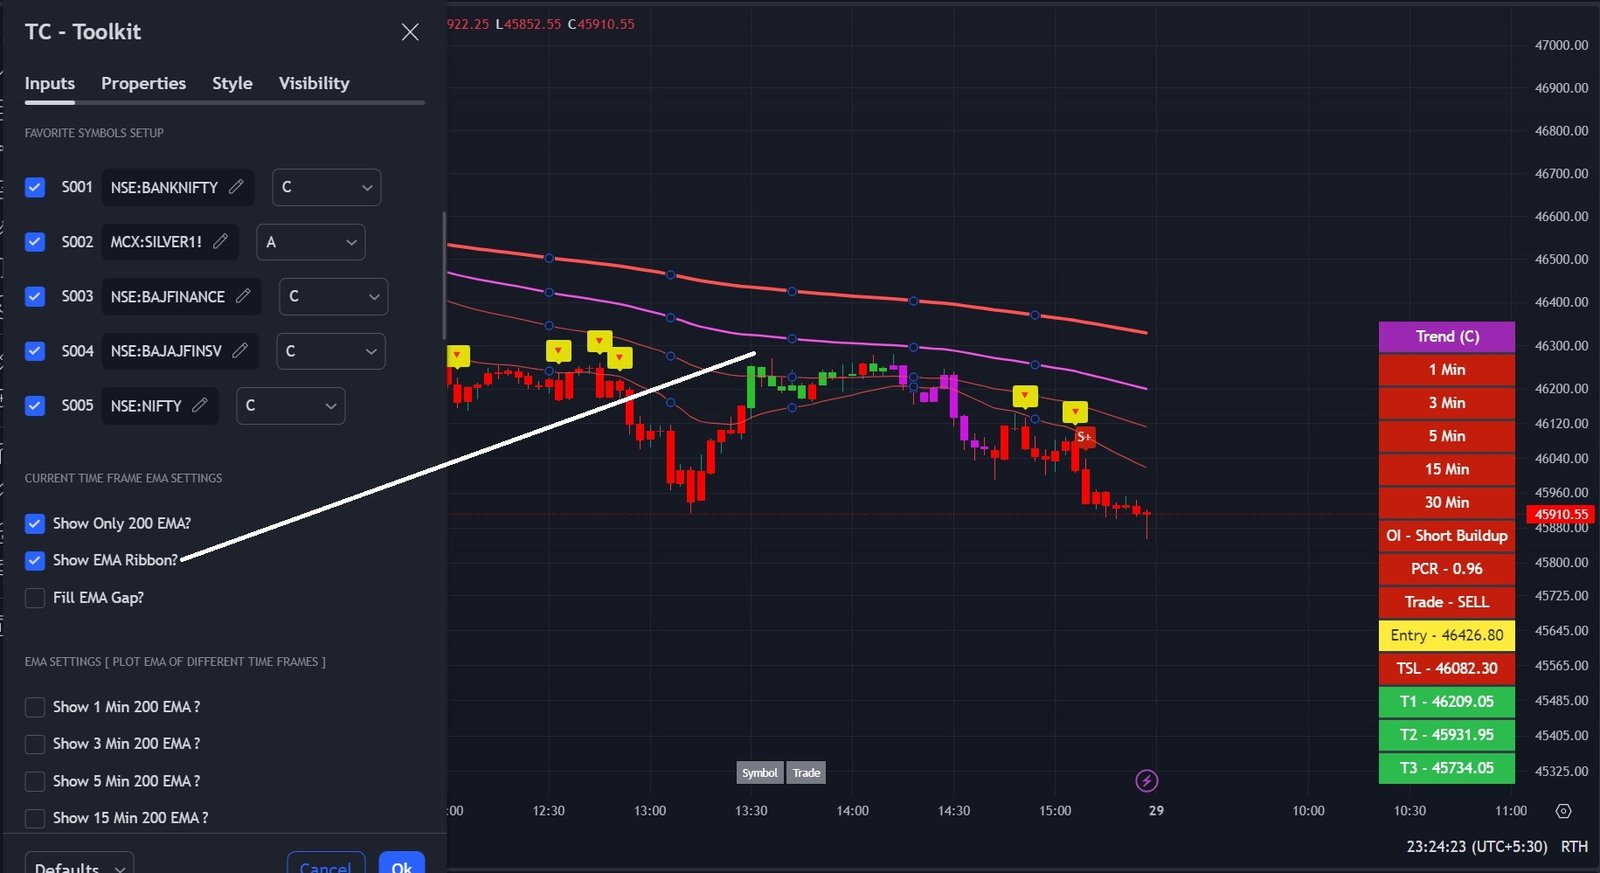
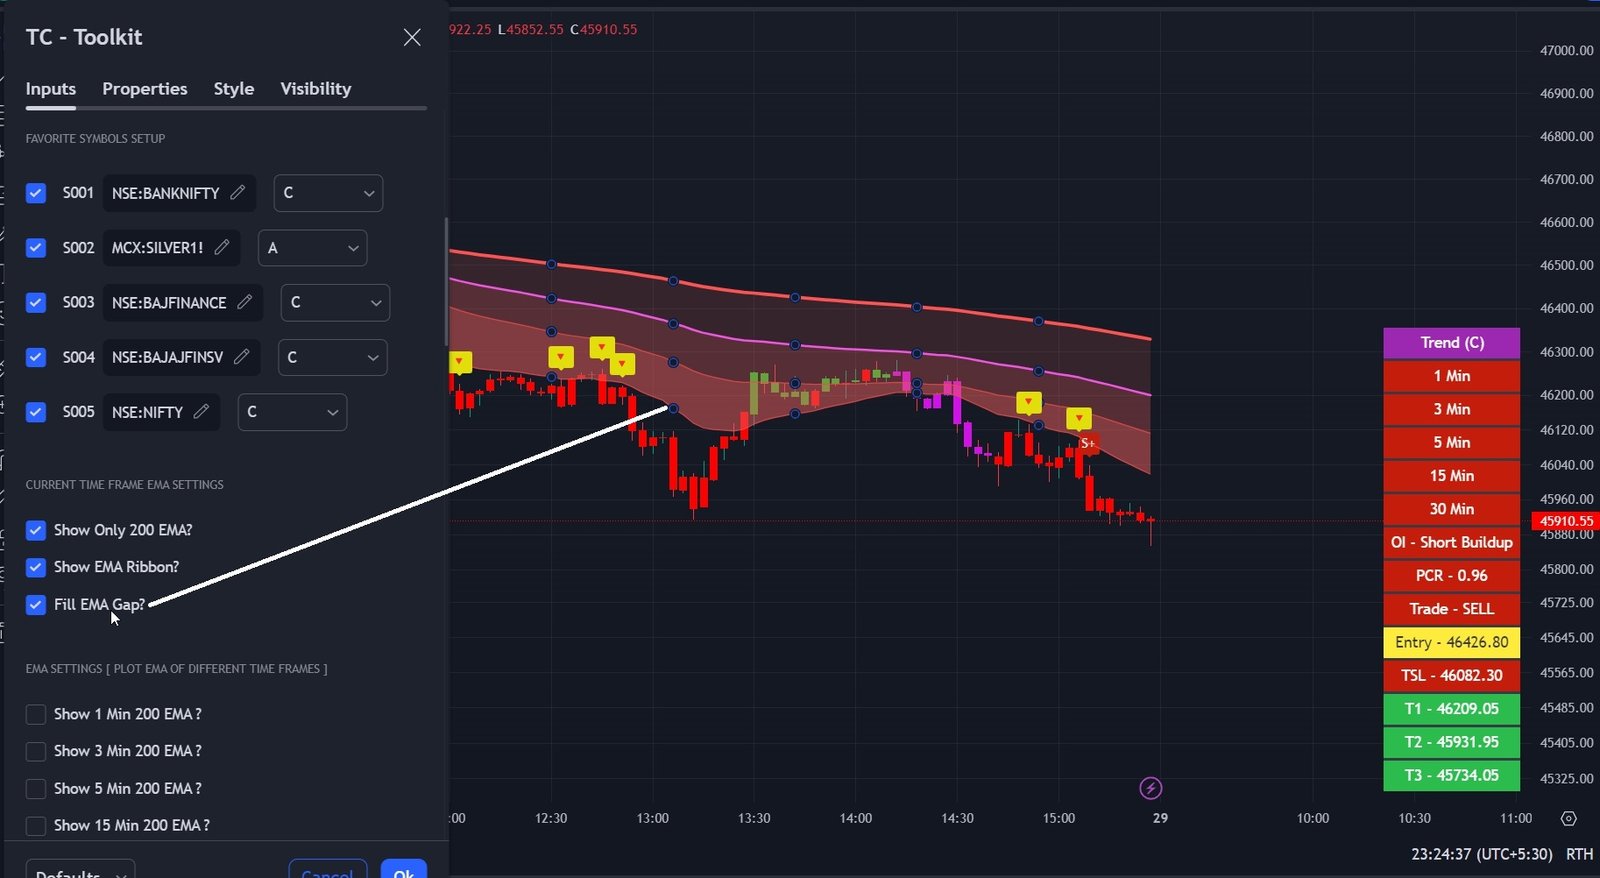
EMA Settings:
Plot the 200 EMA of different timeframe, Let’s take example, if you selected the 3 min time frame, still you can plot the like 1 min, 5 min, 15 min upto daily 200 ema.
it’s helps for support and resistance.
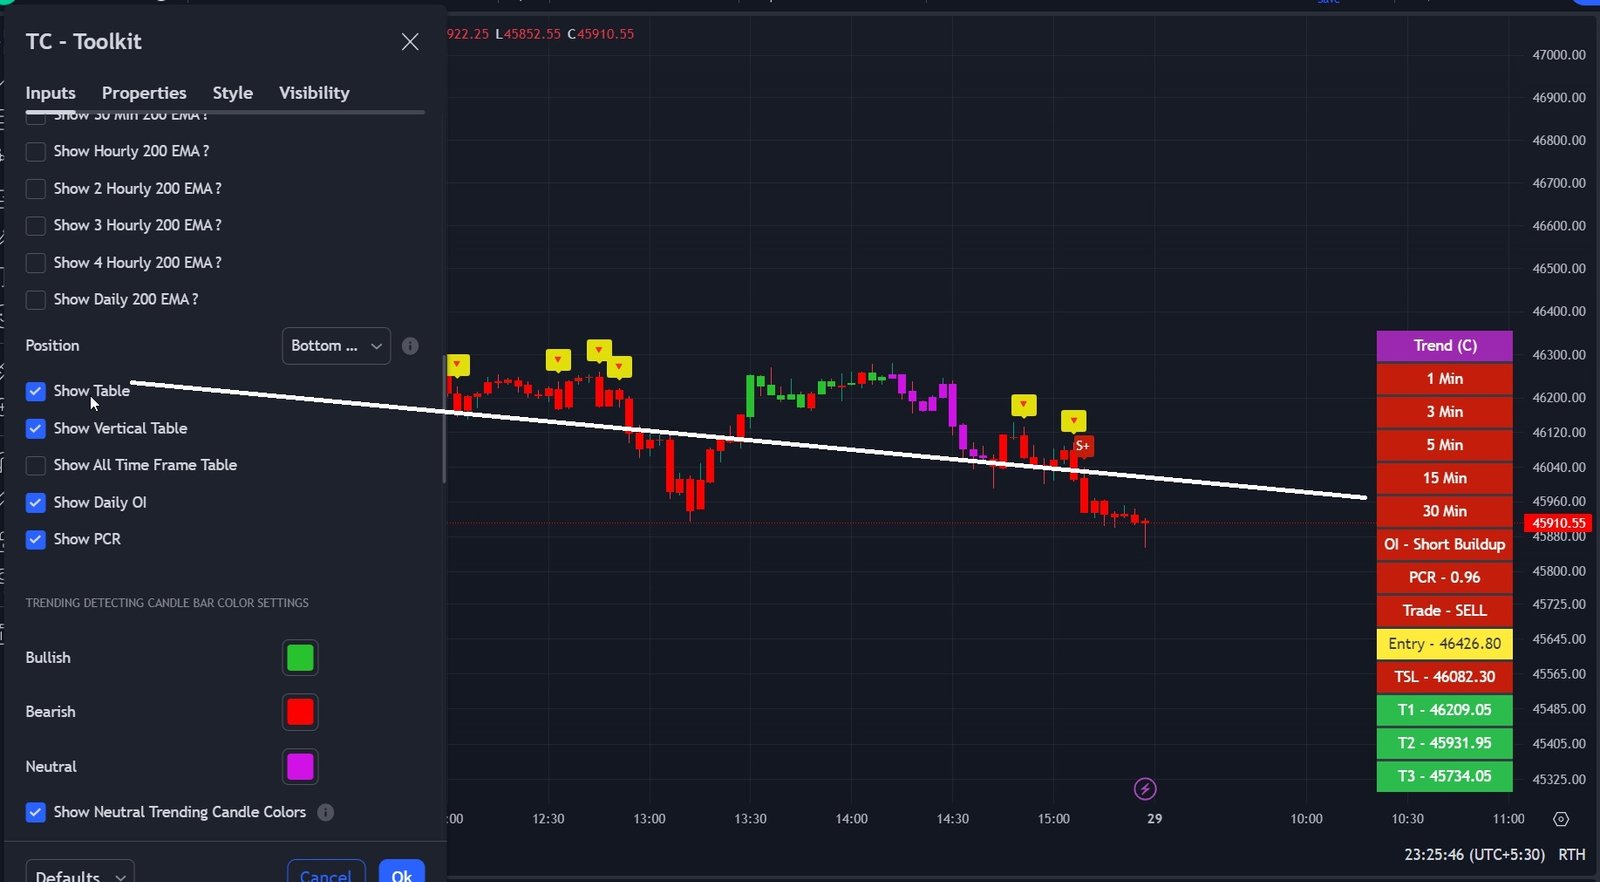
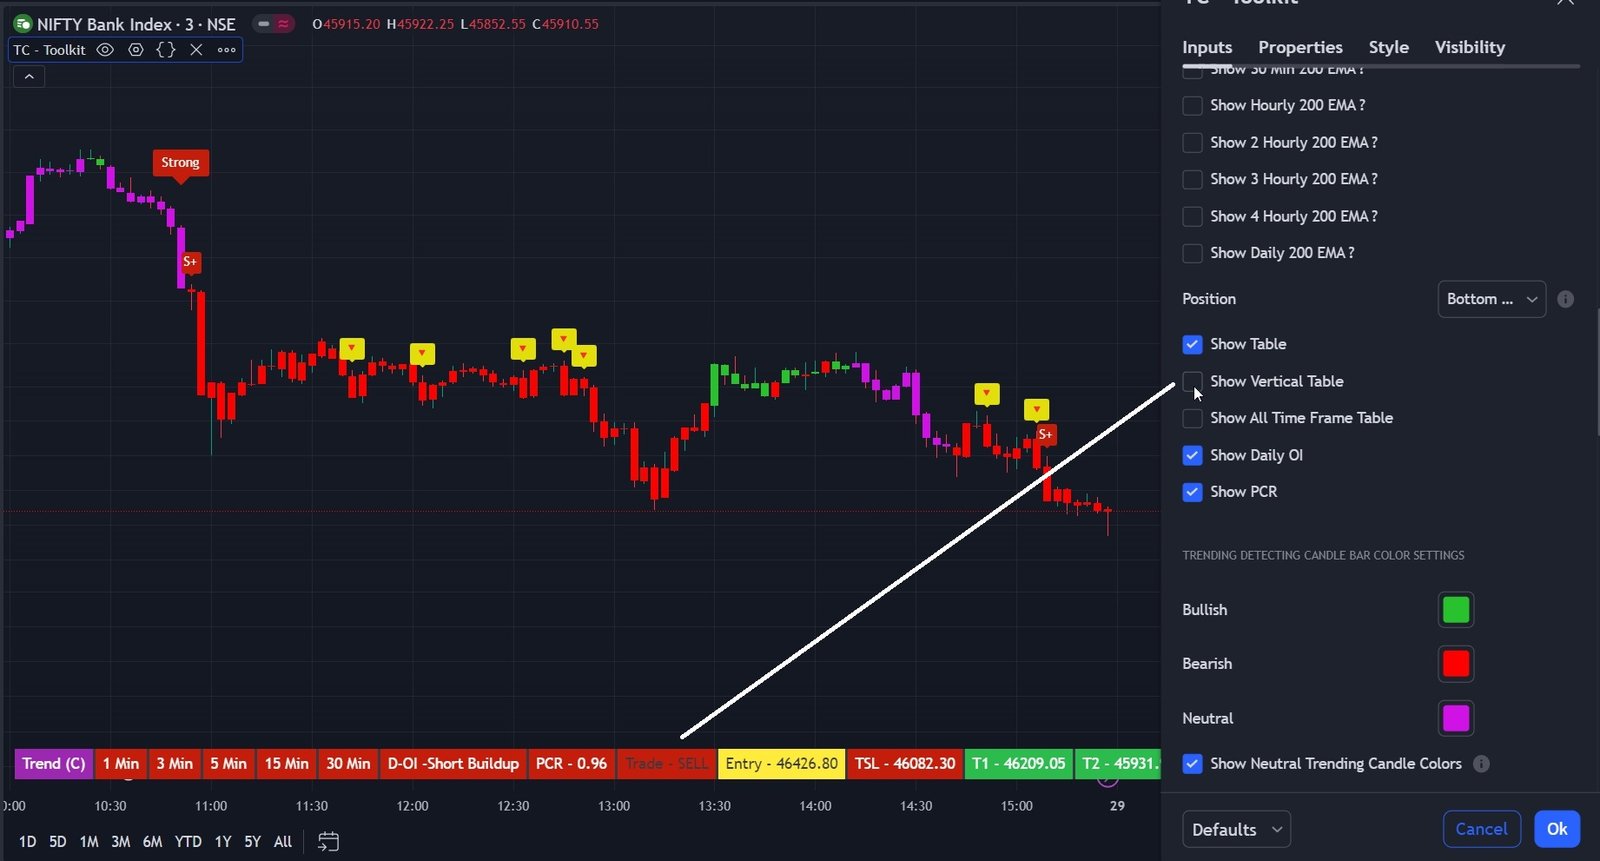
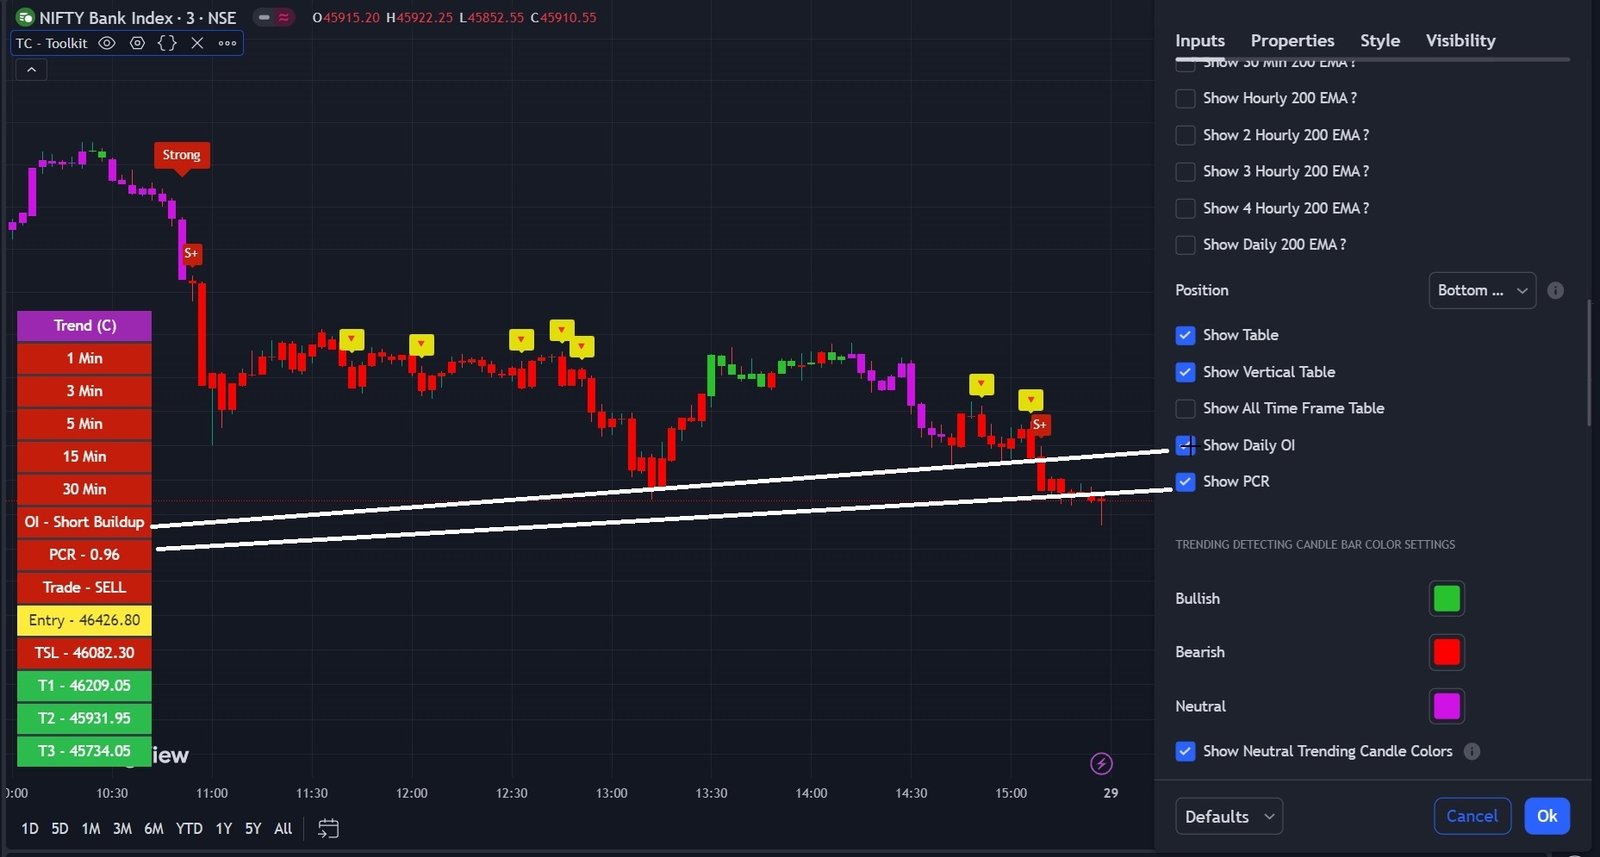
Trend Helper Table
- Show Table : Enable trend helper table
- Position : Position of the table, left bottom or top, or right bottom/top.
- Show Vertical Table : Enable table vertical otherwise horizontal.
- Show All Timeframe Table : By default displaying the small time frame current trend, if want to see higher timeframe like 1 /2/4 hr , daily & weekly then enable the option
- Show Daily, 15, 30 Min OI : All the above options are to see the open interest based on the given timeframe, which always helps to understand the options status.
- Show PCR: Displaying the PCR status, that’s also help to identify the market trend.
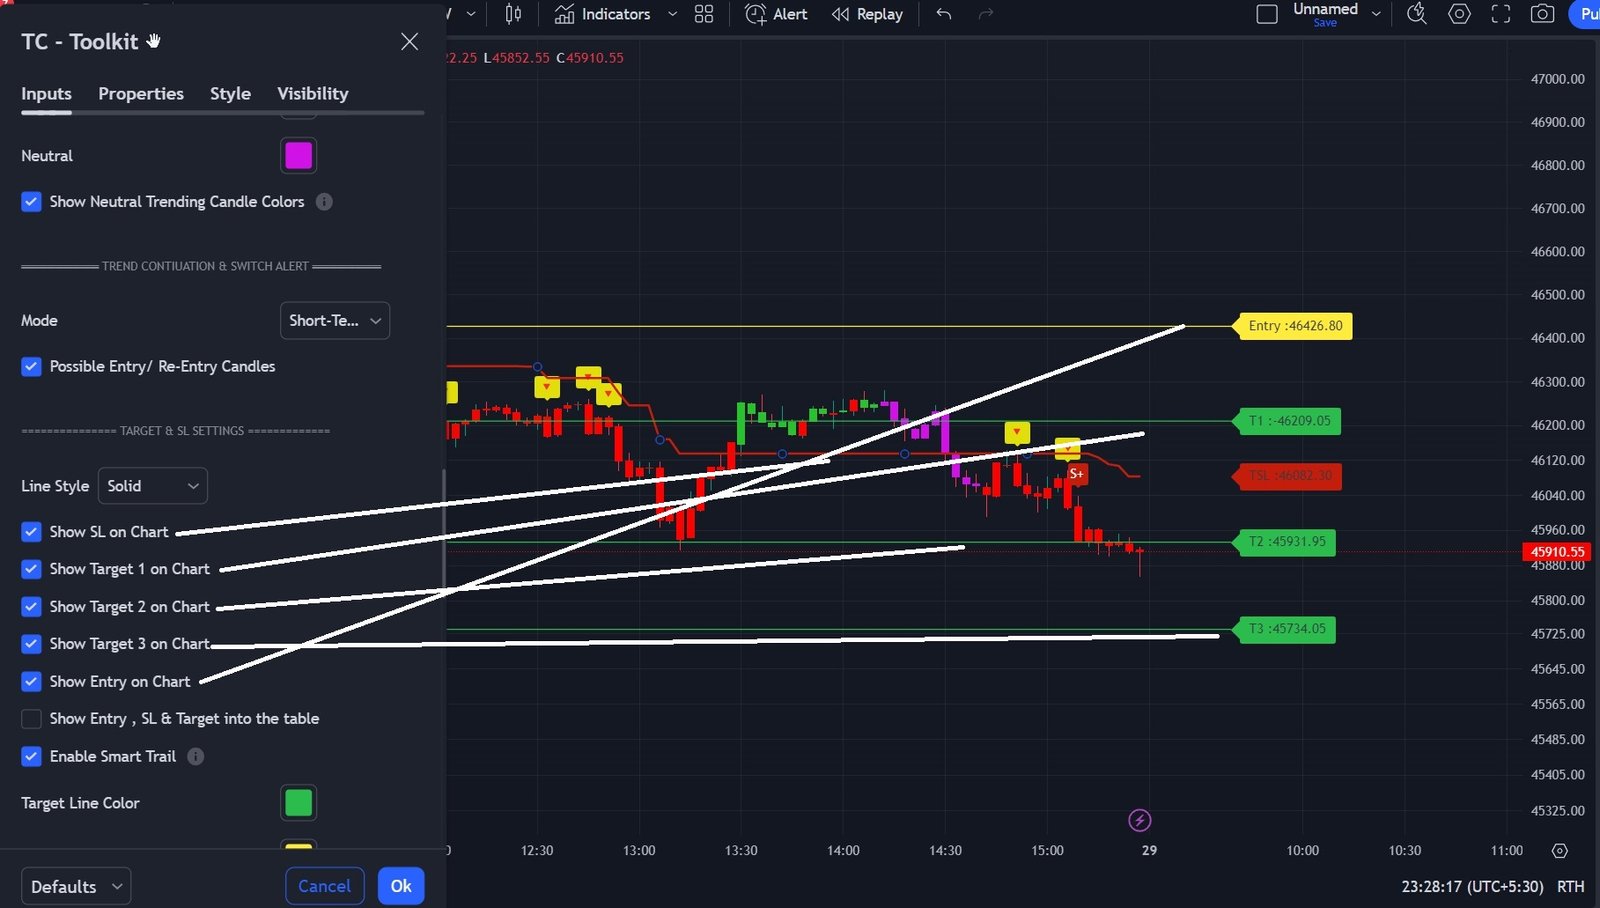
Target & SL Settings
- Show SL on Chart
- Show Target 1 on chart
- Show Target 2 on chart
- Show Target 3 on chart
- Show Entry on chart
—- all above setting to plot the Entry, SL & Targets
- Show Entry , SL & Targets into the table : it’s display the Entry , SL & Targets Price into the table
- Enable Smart Trail : Activate the Smart Trail feature to capture significant reward while the trend is in your favor. Maximize your gains by following these steps.
Additional Settings
- Entry, SL & Target Line Color
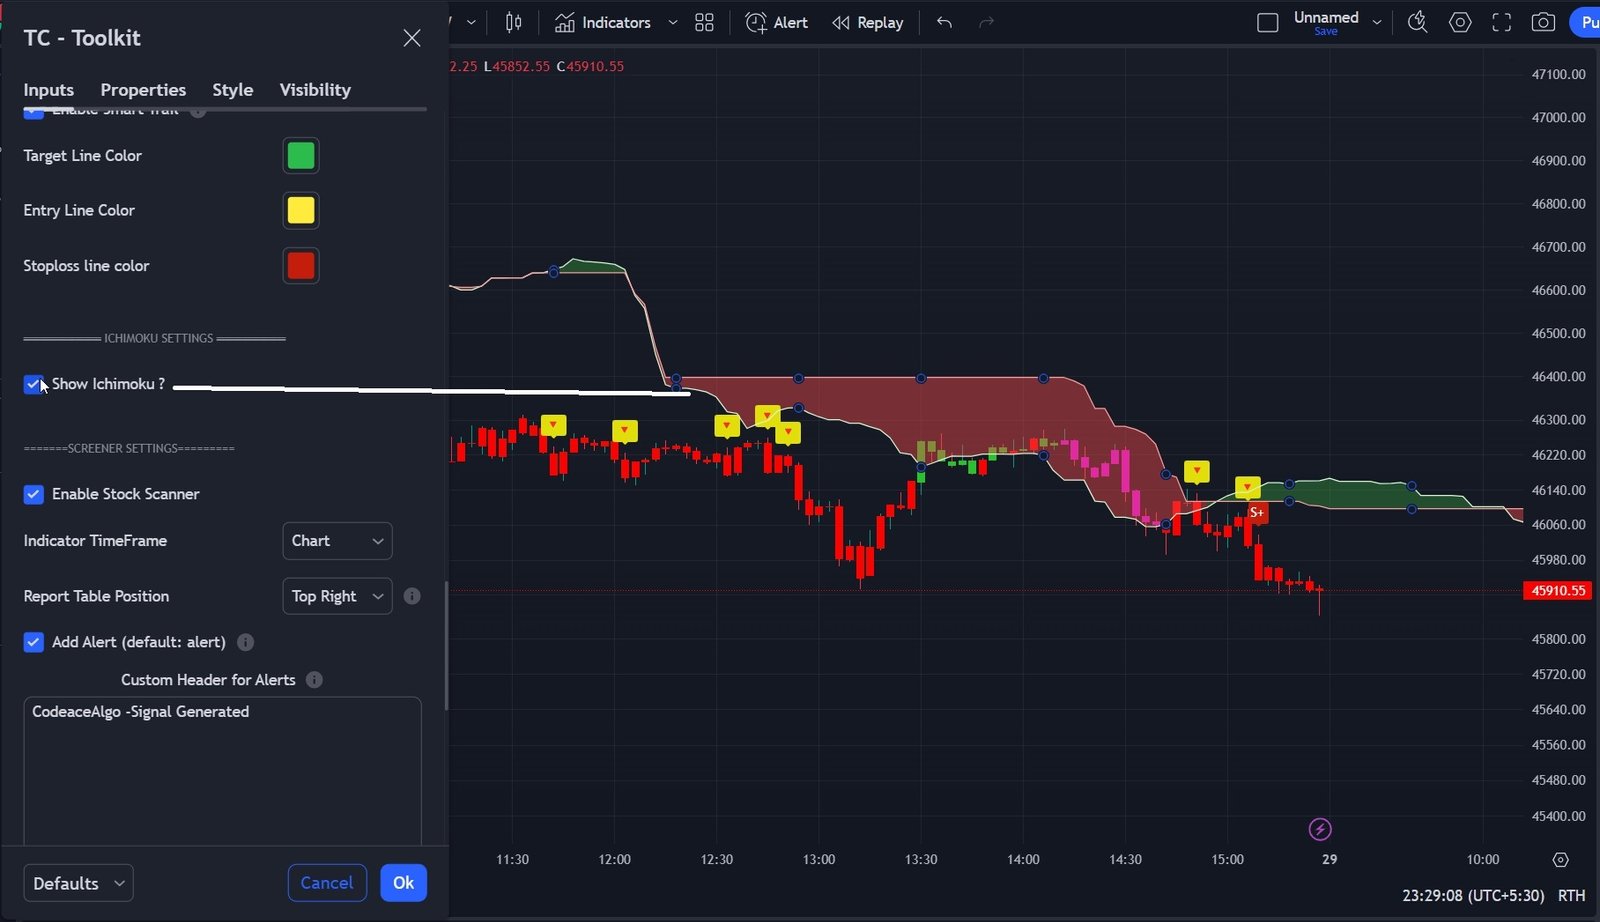
Show Ichimoku :
The Ichimoku Cloud is a collection of technical indicators that show support and resistance levels, as well as momentum and trend direction.
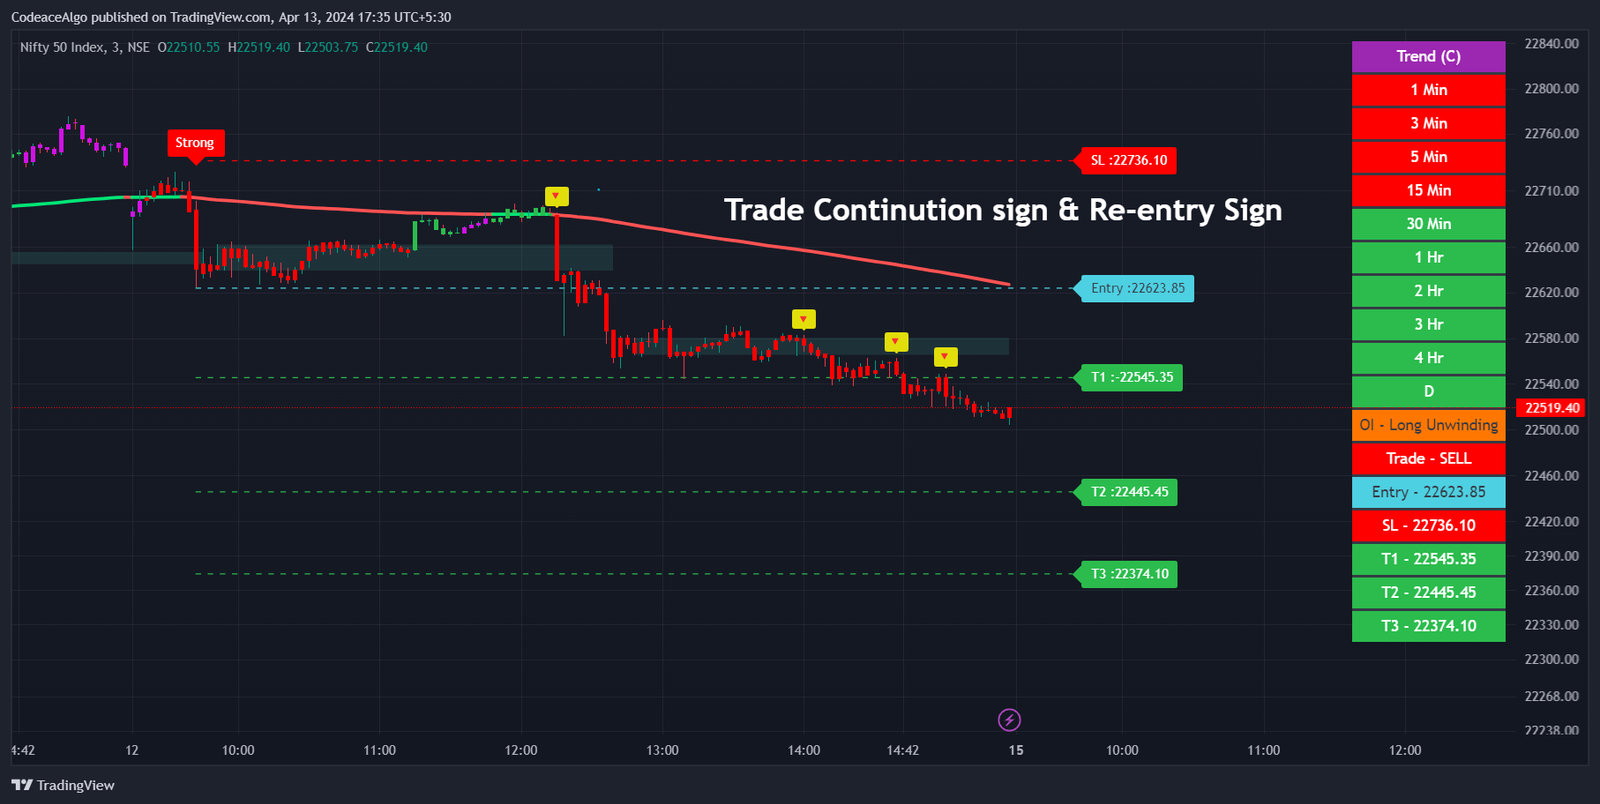
Possible Entry or Re-Entry Candle Sign:
Stay in your current trade confidently with the Yellow Trade Continuation Sign. This feature guides you to exercise patience and maximize your gains.
it’s Trend Continuation sign
Screener Settings
- Enable Stock Screener : Enable it if want to catch the real time for specific 5 stocks ( Associated in the setup )
- Table Position : Position of the screener report table
- Add Alert : Setup Alert ( Please make sure you have setup alert through trading view , only in that case this setting will work )
- Symbols : User can customize the attached stocks, can select any 5 stocks, screener will be work only for those stocks.

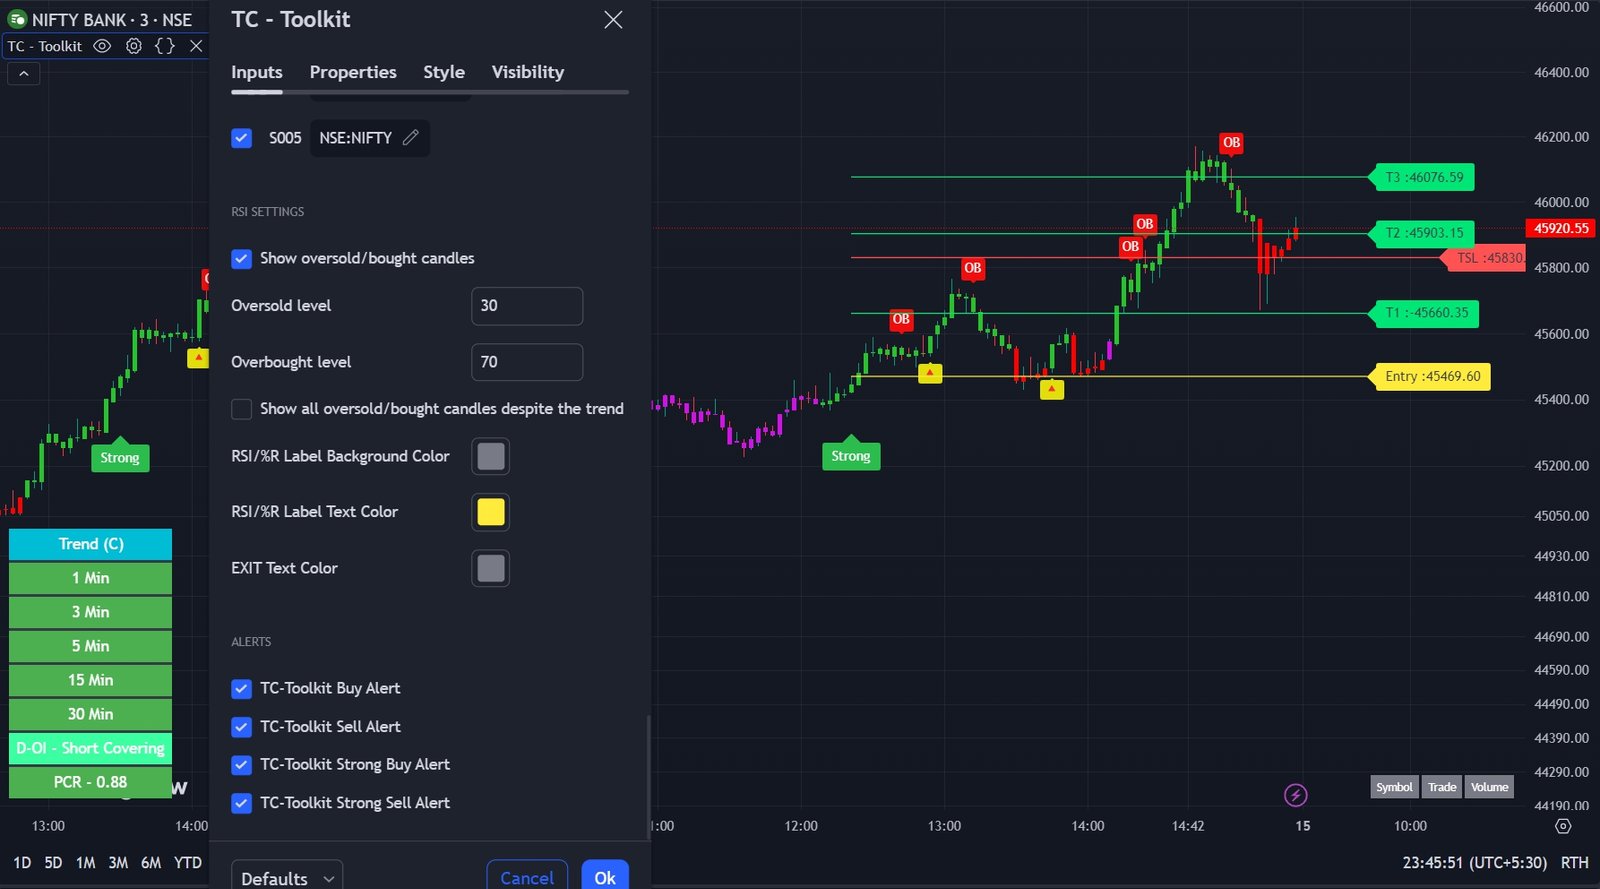
RSI Settings:
Show oversold/bough candles: it will help to take reward or exit based on oversold or overbought sign